ClusterLog
A journal for cluster headaches, made for logging an attack while it's happening: one tap at a time, half-awake, at 3 a.m. Free, in any browser on your phone or computer.
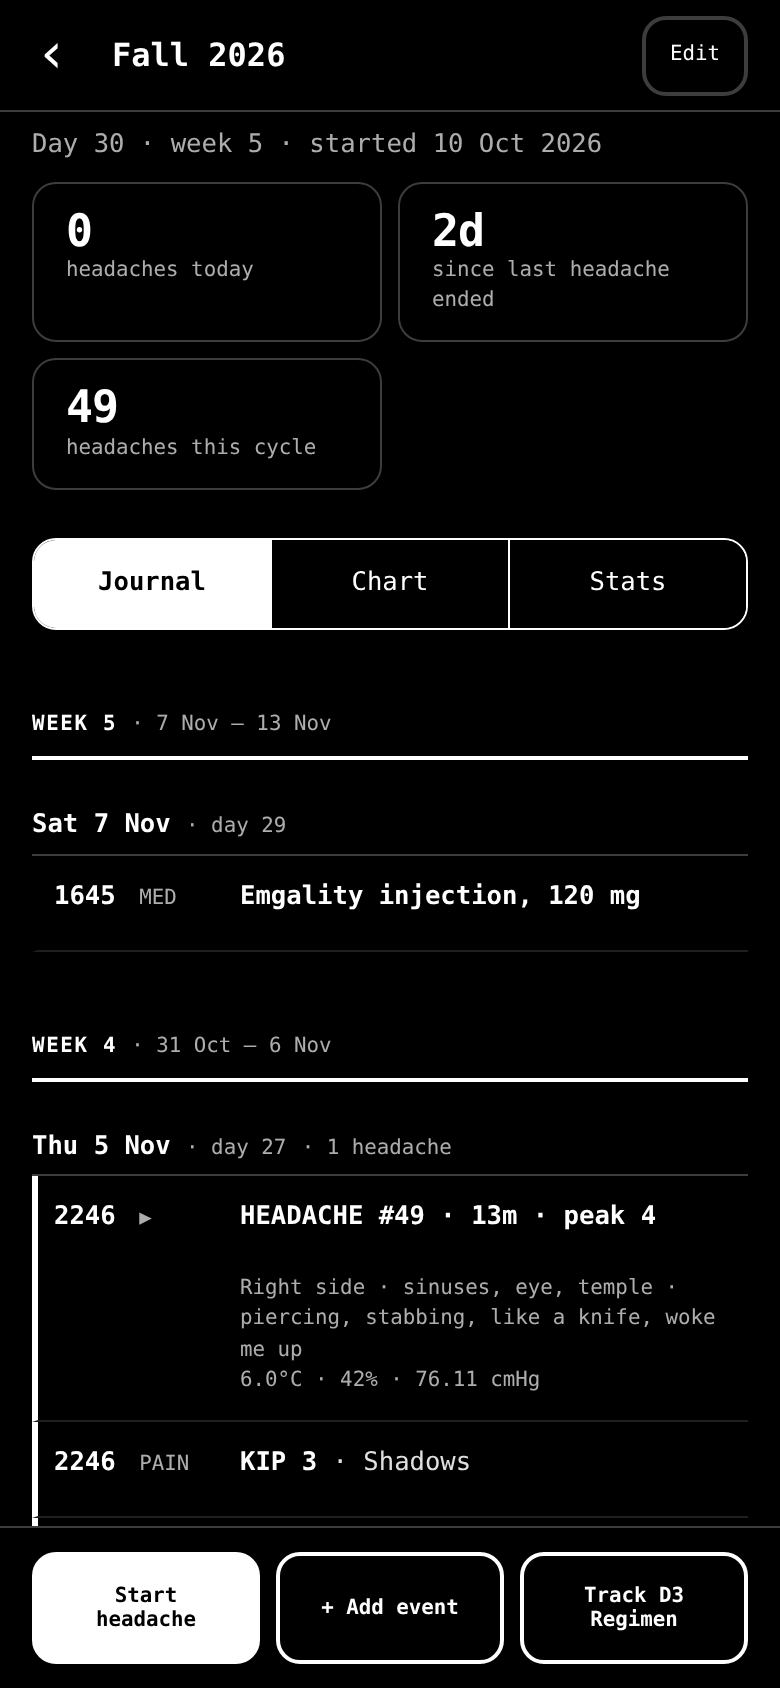
The screens below are from a real cycle: Jason's own Fall 2026 journal, 49 headaches in 30 days.
Log it as it happens
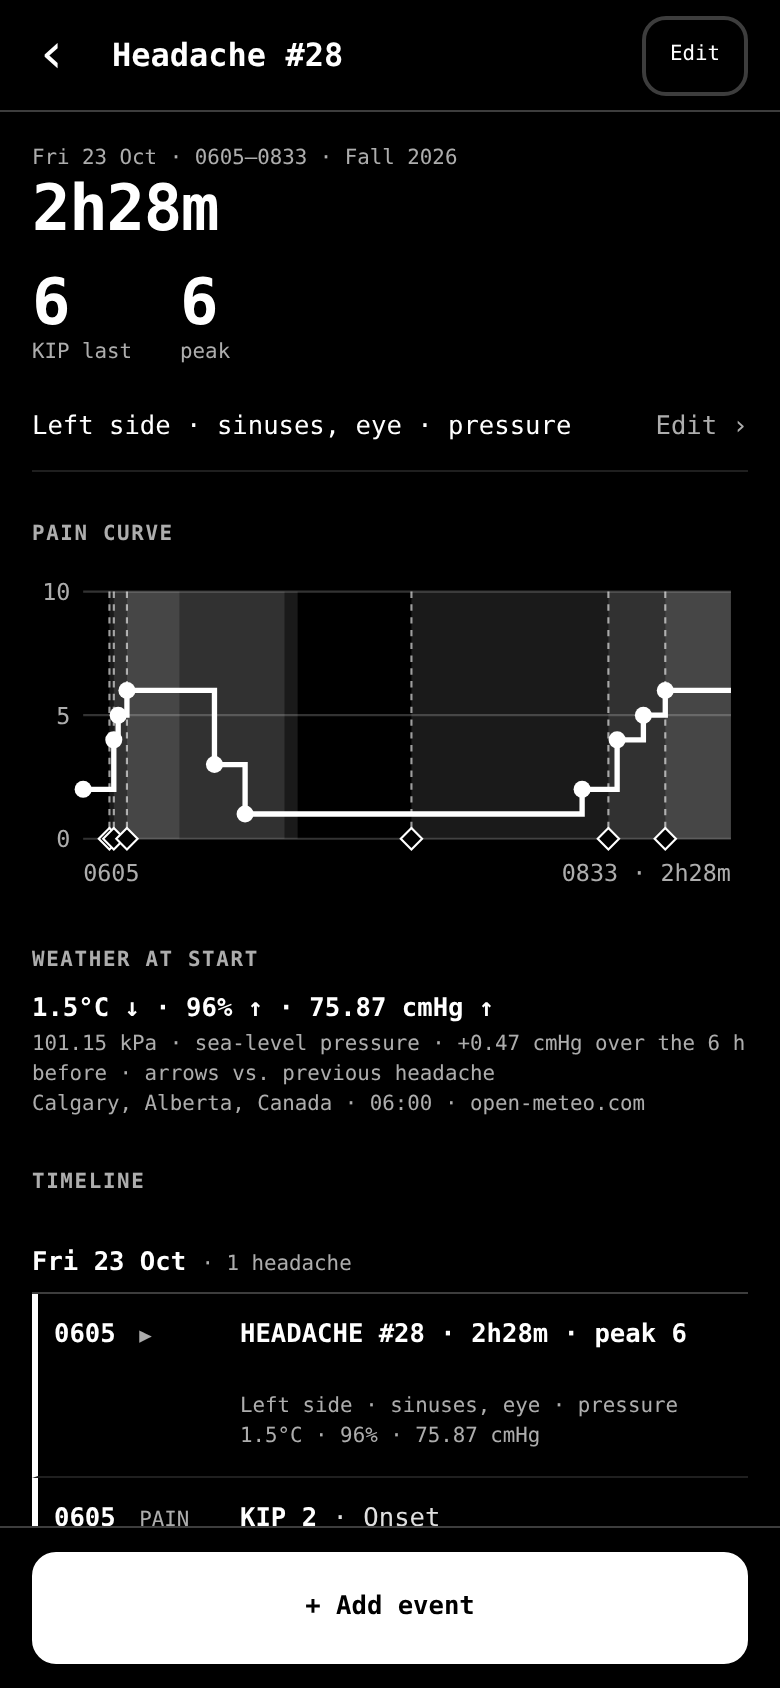
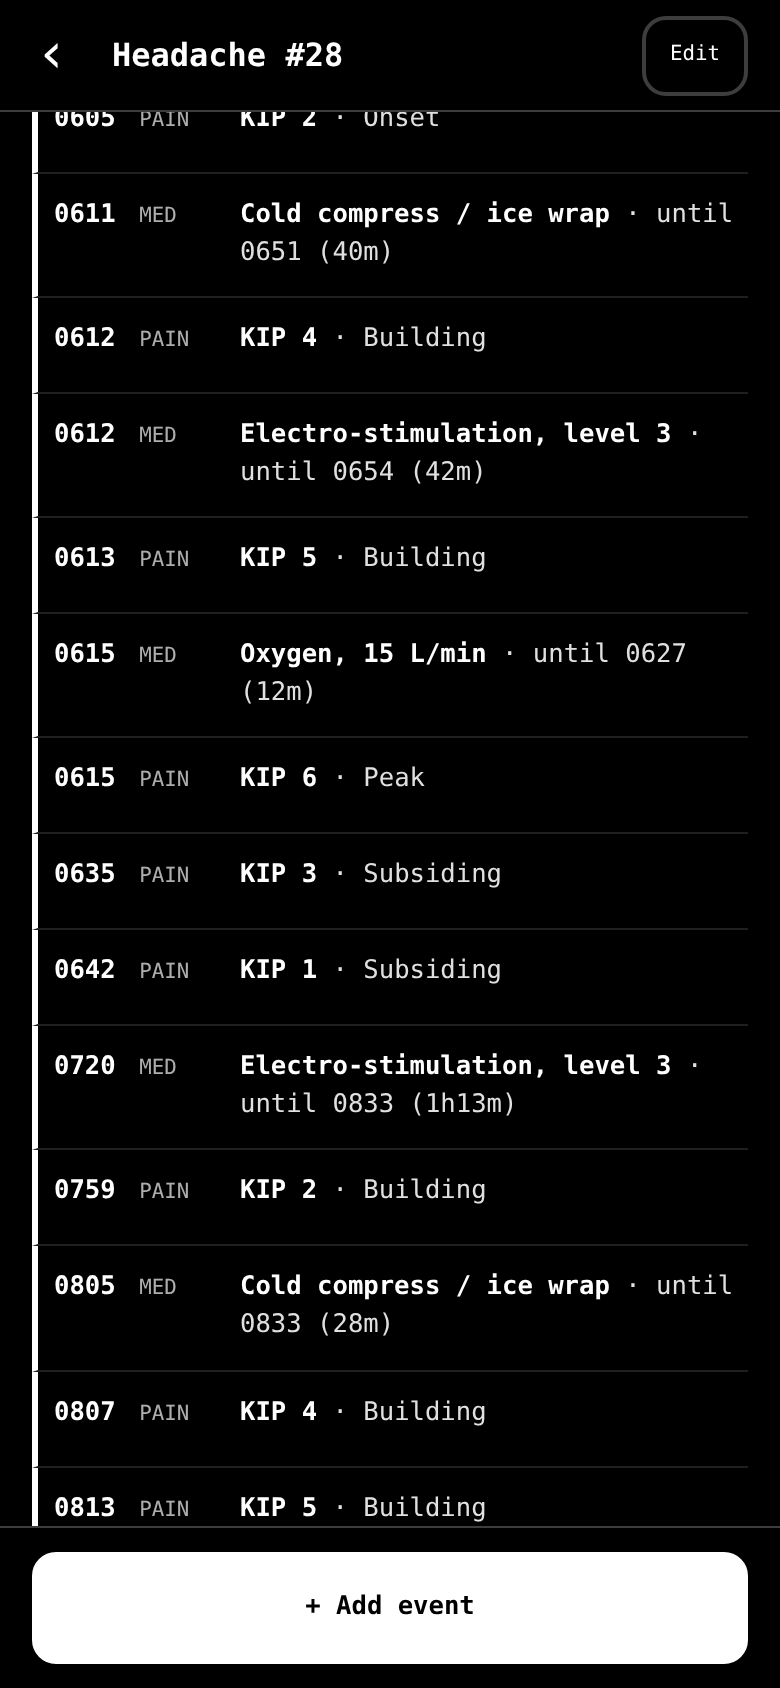
Tap Start headache and the time defaults to now. Add shadows or onset, KIP, side, location and pain type. As it goes, tap to log pain changes, meds, oxygen or a quick note, then tap End. Anything can be fixed later.
Each headache gets its own page: length, KIP now and at peak, the pain curve, and the weather when it started.
Meds in one tap
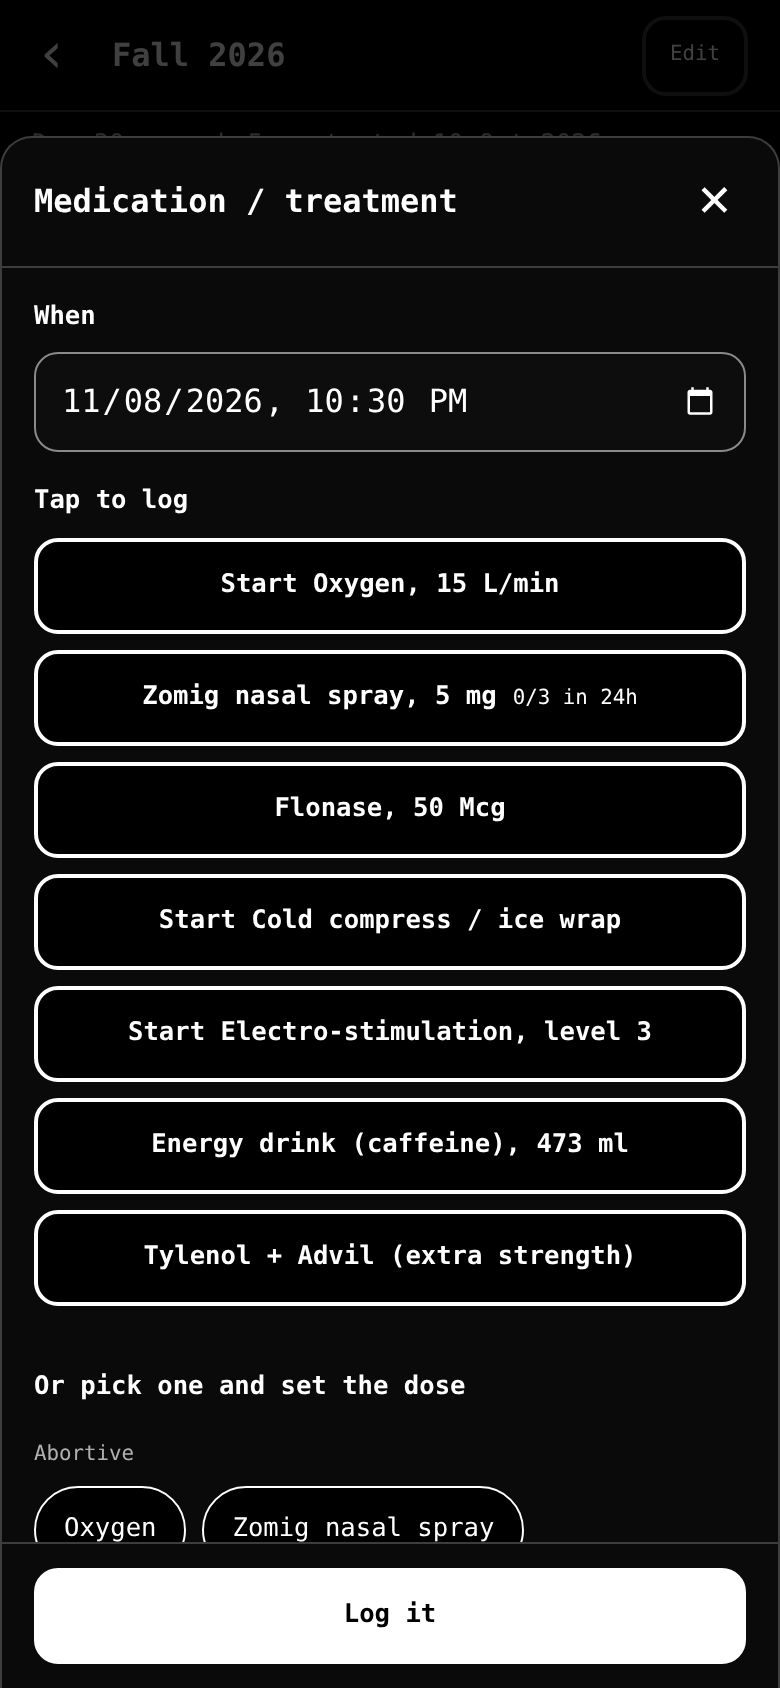
Set up your usual treatments once with their normal dose. Mid-attack, one tap logs them. Oxygen, ice and other timed treatments start and stop. ClusterLog warns you when you reach a daily limit, like 0 of 3 Zomig in 24 hours.
Your whole cycle at a glance
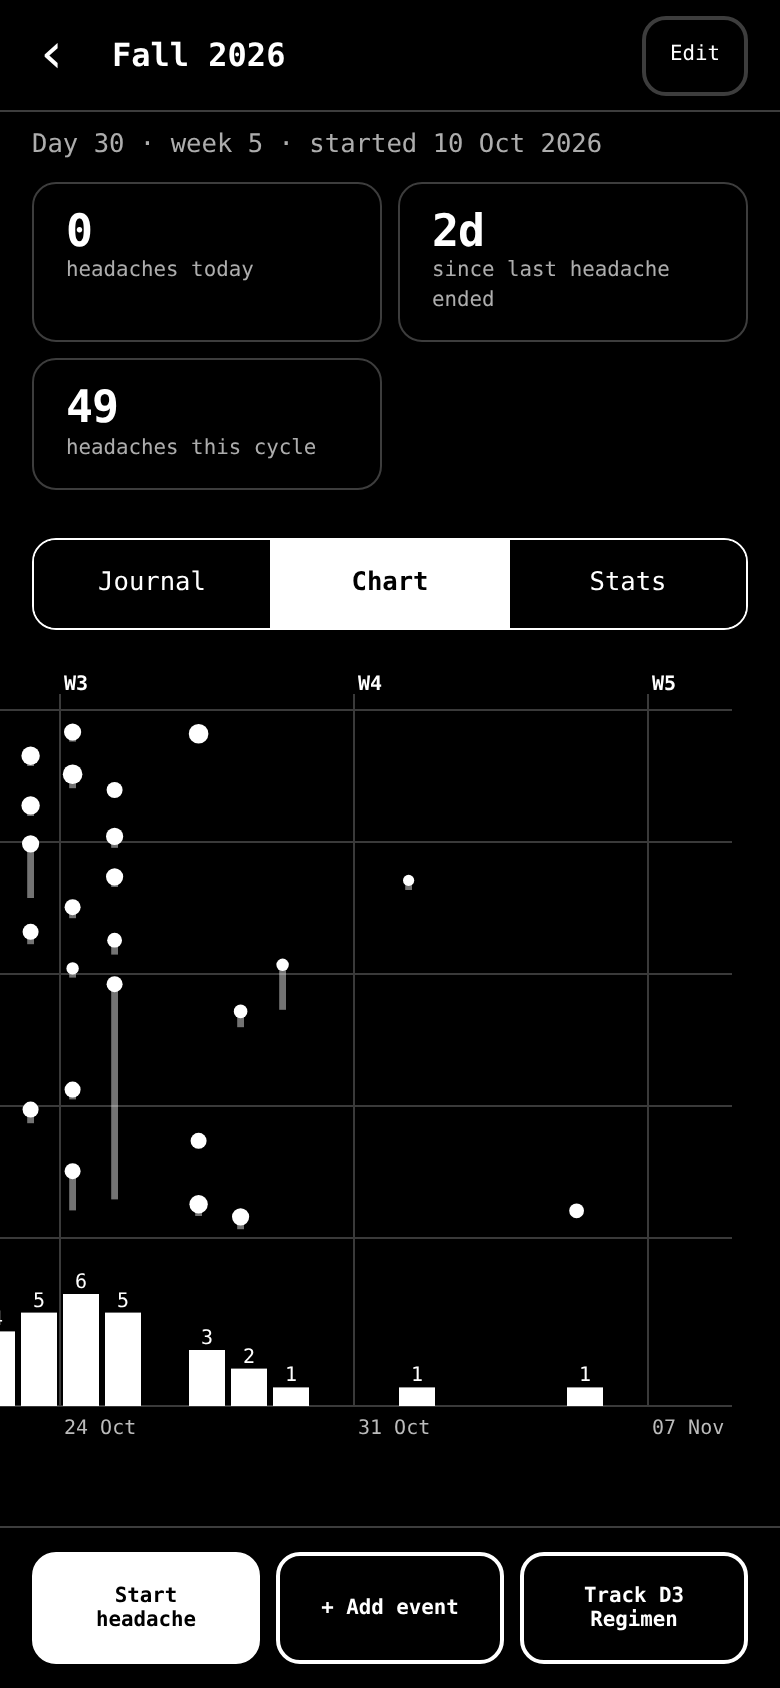
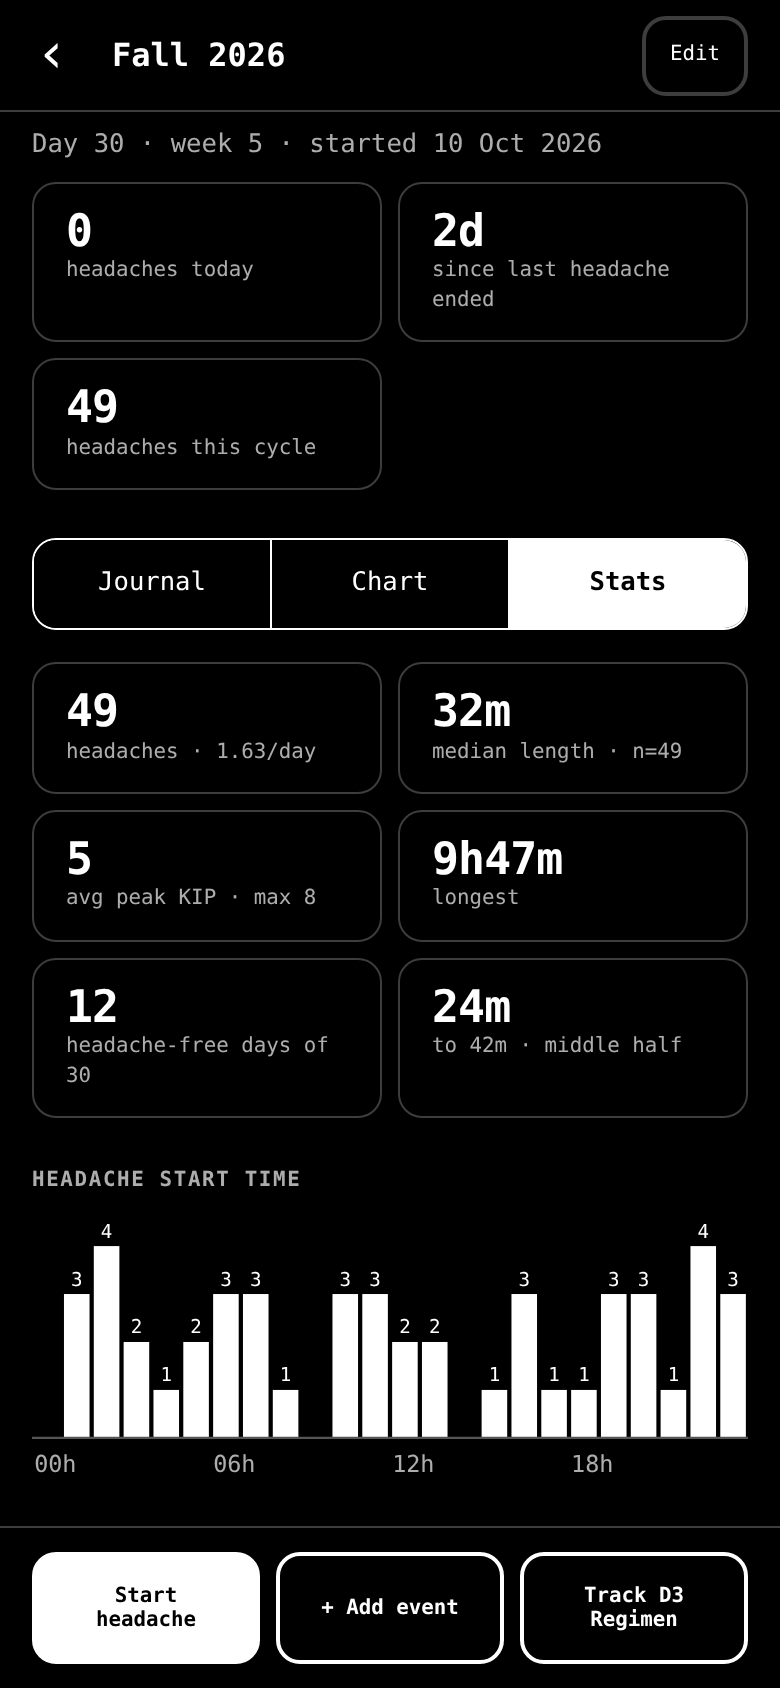
Every cycle has day and week counts, plus a journal, a chart and stats. The chart shows days across and time of day down, so the clock-like pattern of cluster headaches is easy to spot. Stats show when headaches start, how long they last and how many days were headache-free.
See what works
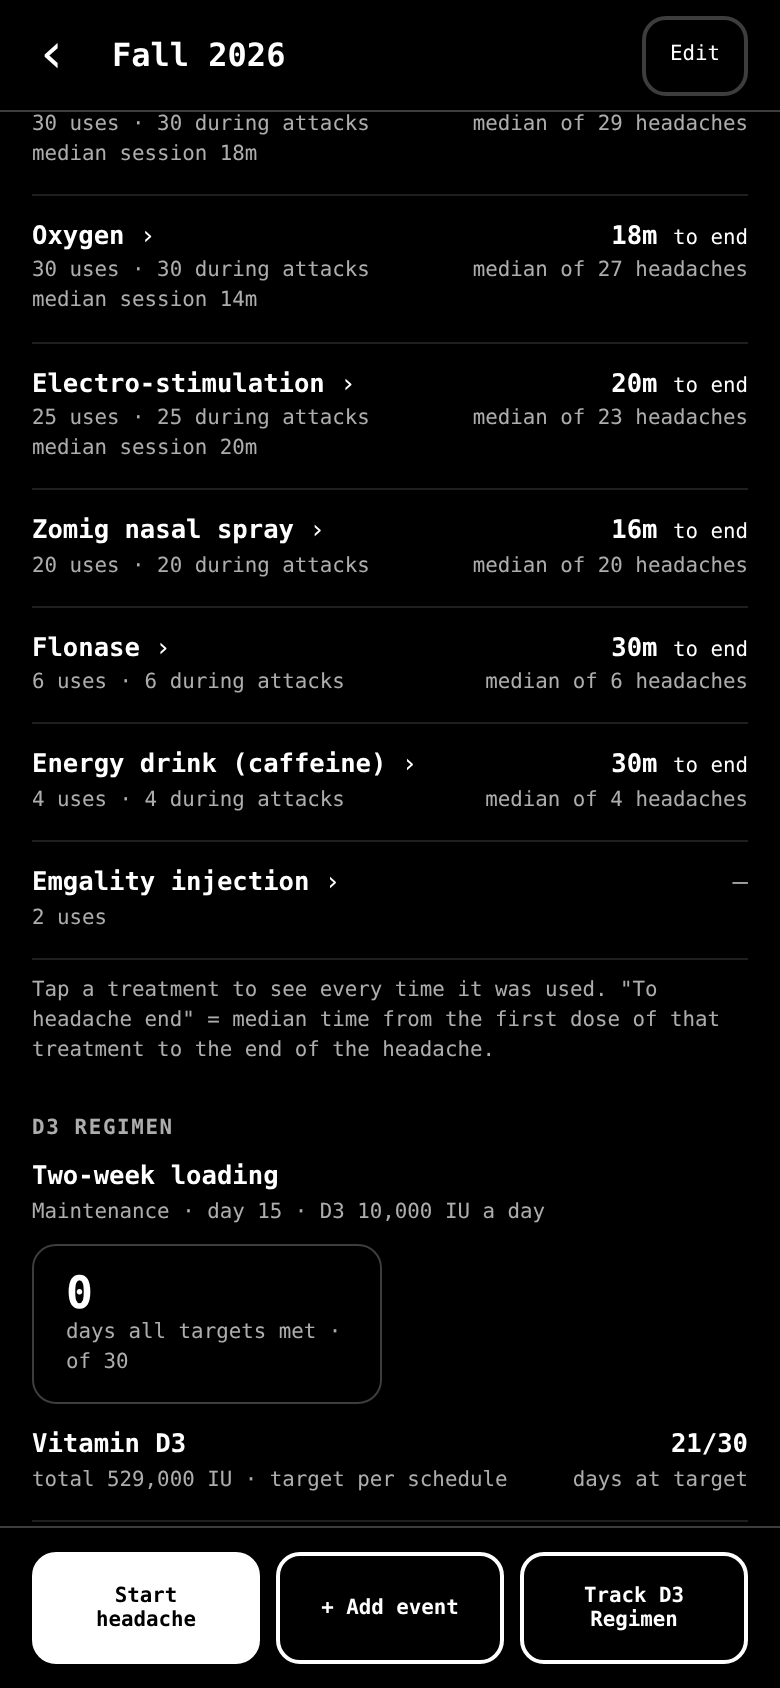
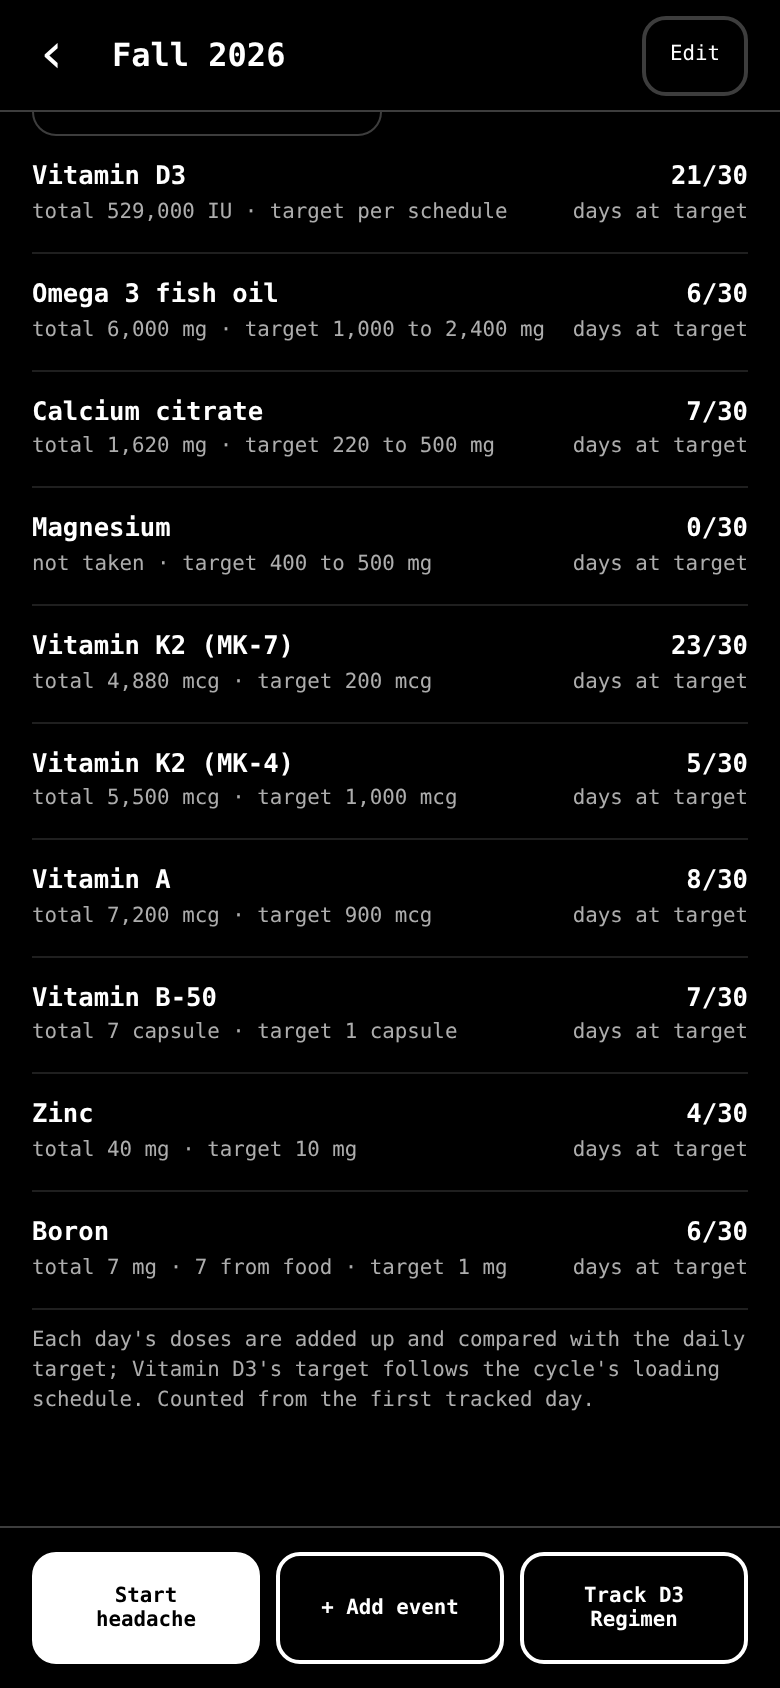
For each treatment: how often you used it and the median time from first dose to the end of the headache. There's also a vitamin D3 regimen tracker that compares each day's doses with your targets.
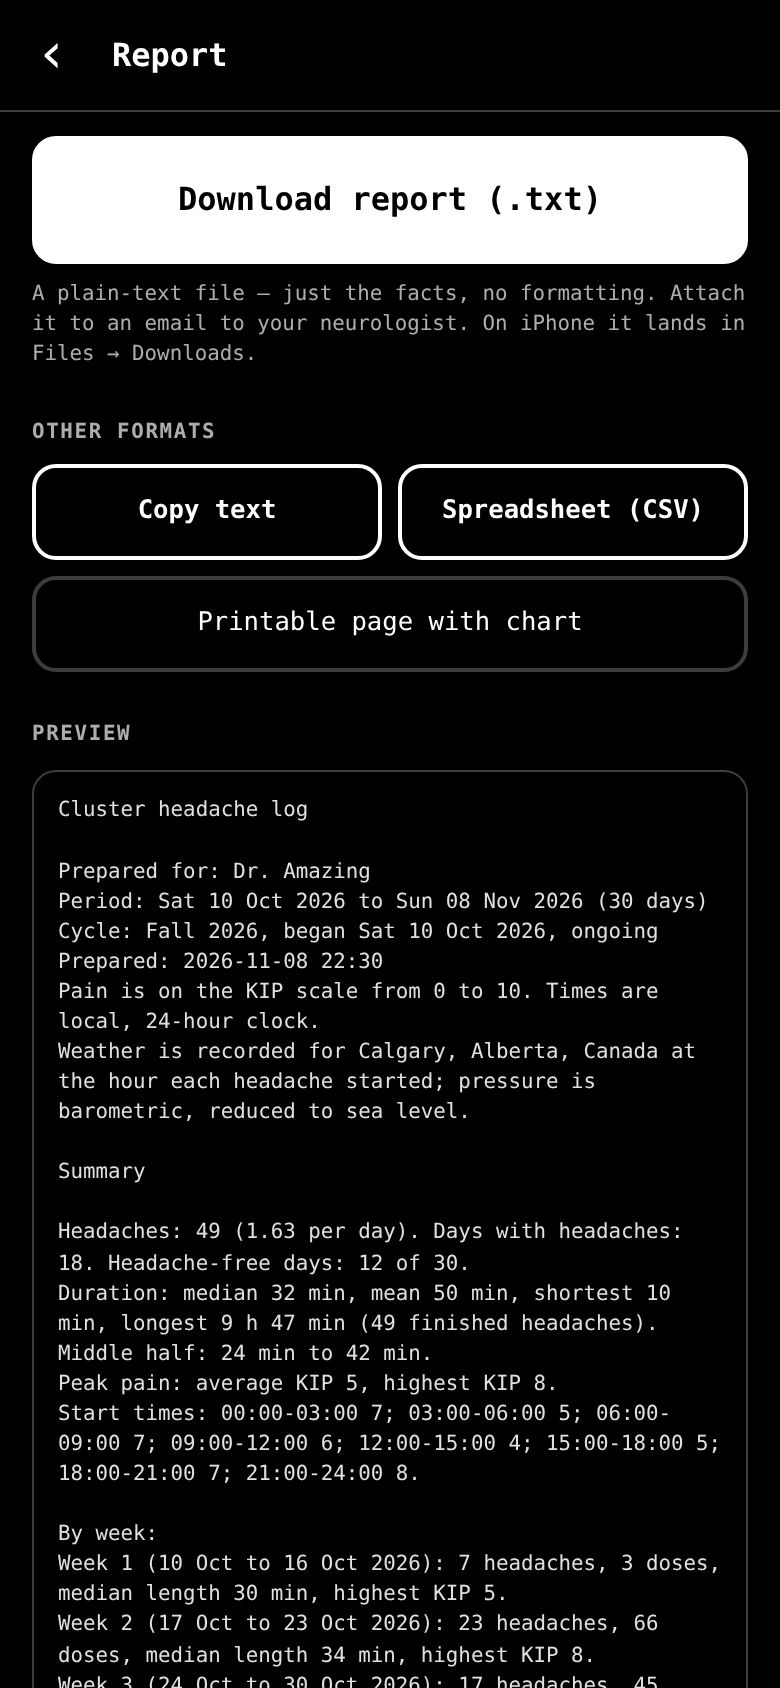
A report for your neurologist
Pick a date range and get a plain-text report to download and attach, copy, print with a chart, or export as a spreadsheet.
To send reports straight from ClusterLog to your neurologist, donate $5 on Ko-fi with your ClusterLog email in the message and it's unlocked for your account. Everything else is free.
Your data
- Where is it kept?
- In Canada. The server is in Toronto and the off-site backups are in Backblaze's Canadian region.
- Who can see it?
- You, plus your neurologist for the reports you choose to send. Your journal is encrypted with a passphrase only you know, so nobody else can open it, including the person who runs zalApps. It isn't sold, shared or used for advertising.
- Is it protected?
- Every connection uses HTTPS. Your journal and its backups are encrypted with 256-bit AES, and the server never stores your key, your passphrase or your recovery code.
- Can I leave?
- Yes. Settings has Delete account, which removes your account and journal right away.
Try it
Sign up with your email address and you're in. Add it to your home screen and it opens like a regular app. Ideas are welcome at contact@zalapps.net.